
Hold Percentage
GAMWIT's Hold Percentage model predicts the share of each player's wagers the platform keeps as revenue over the next 30 to 365 days, so you can forecast revenue player by player.
Player Predicted hold
- #2041711.8%High contributor
- #318829.4%Above average
- #440256.1%Around average
- #509132.3%Below average
Example rows, not live data shape as in the GAMWIT platform
What your team receives
Where the active base sits against the platform average
- Above average
- Around average
- Below average
These are sample players. In a walkthrough, we run the Hold Percentage model on yours.
Book a walkthroughHow it works
What the Hold Percentage model reads and returns
What hold percentage is
The portion of player wagers the platform retains as revenue, expressed as a percentage of total bets placed. The model's target is GGR divided by bets.
A forward view, per player
GAMWIT predicts the expected hold percentage for each player over the next 30, 75, 90, 180, 270 or 365 days, so a platform-wide ratio becomes a revenue forecast per player.
Built from the same data as the other models
Betting activity, NGR, GGR, deposits and withdrawals. 90 days of history to start, with 1 to 1.5 years kept for model stability.
In practice
How teams use the Hold Percentage model
How to use the results
- Forecast platform revenue at the level of the individual player.
- Identify high-contributing players for targeted engagement.
- Size marketing and retention spend against expected revenue.
Try it yourself
Start a free trial. See your first predictions in about 15 minutes.
Sign up and build your first model yourself, no setup call needed. Prefer a guided tour? Book a walkthrough instead.
Can you trust it
Check the Hold Percentage model before you use it, and after.
Every GAMWIT model comes with the same three screens: how it tested, the data behind each score, and a warning when your data changes. These are real captures from a licensed account.
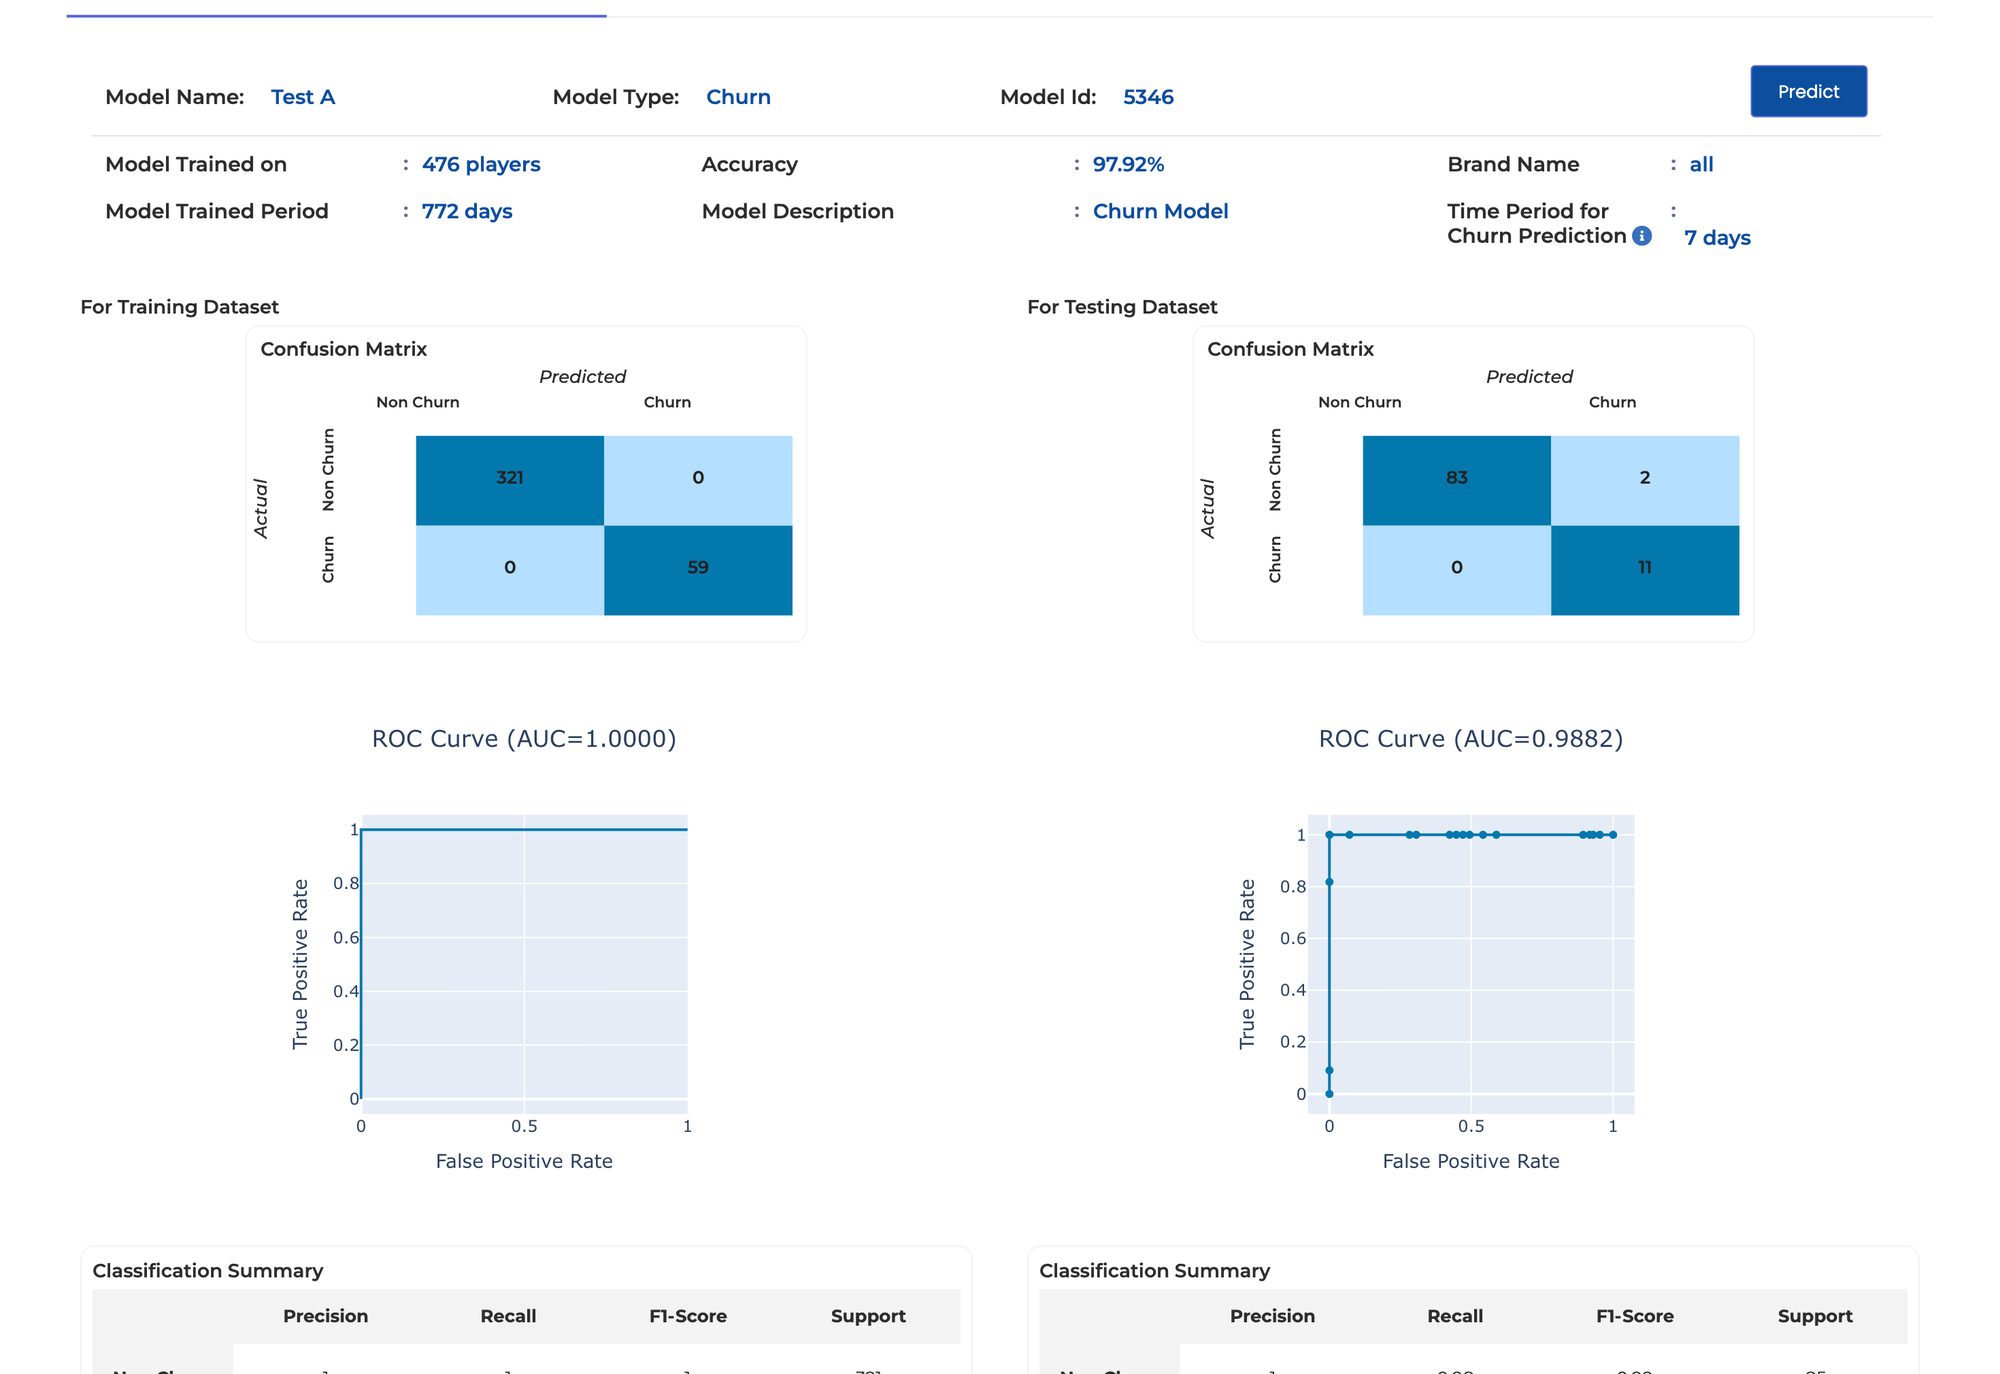
How often the model was right, on the players it learned from and on players it had never seen, shown separately, not as one overall number.
Shown for the Player Churn model, 476 players. Sample data.
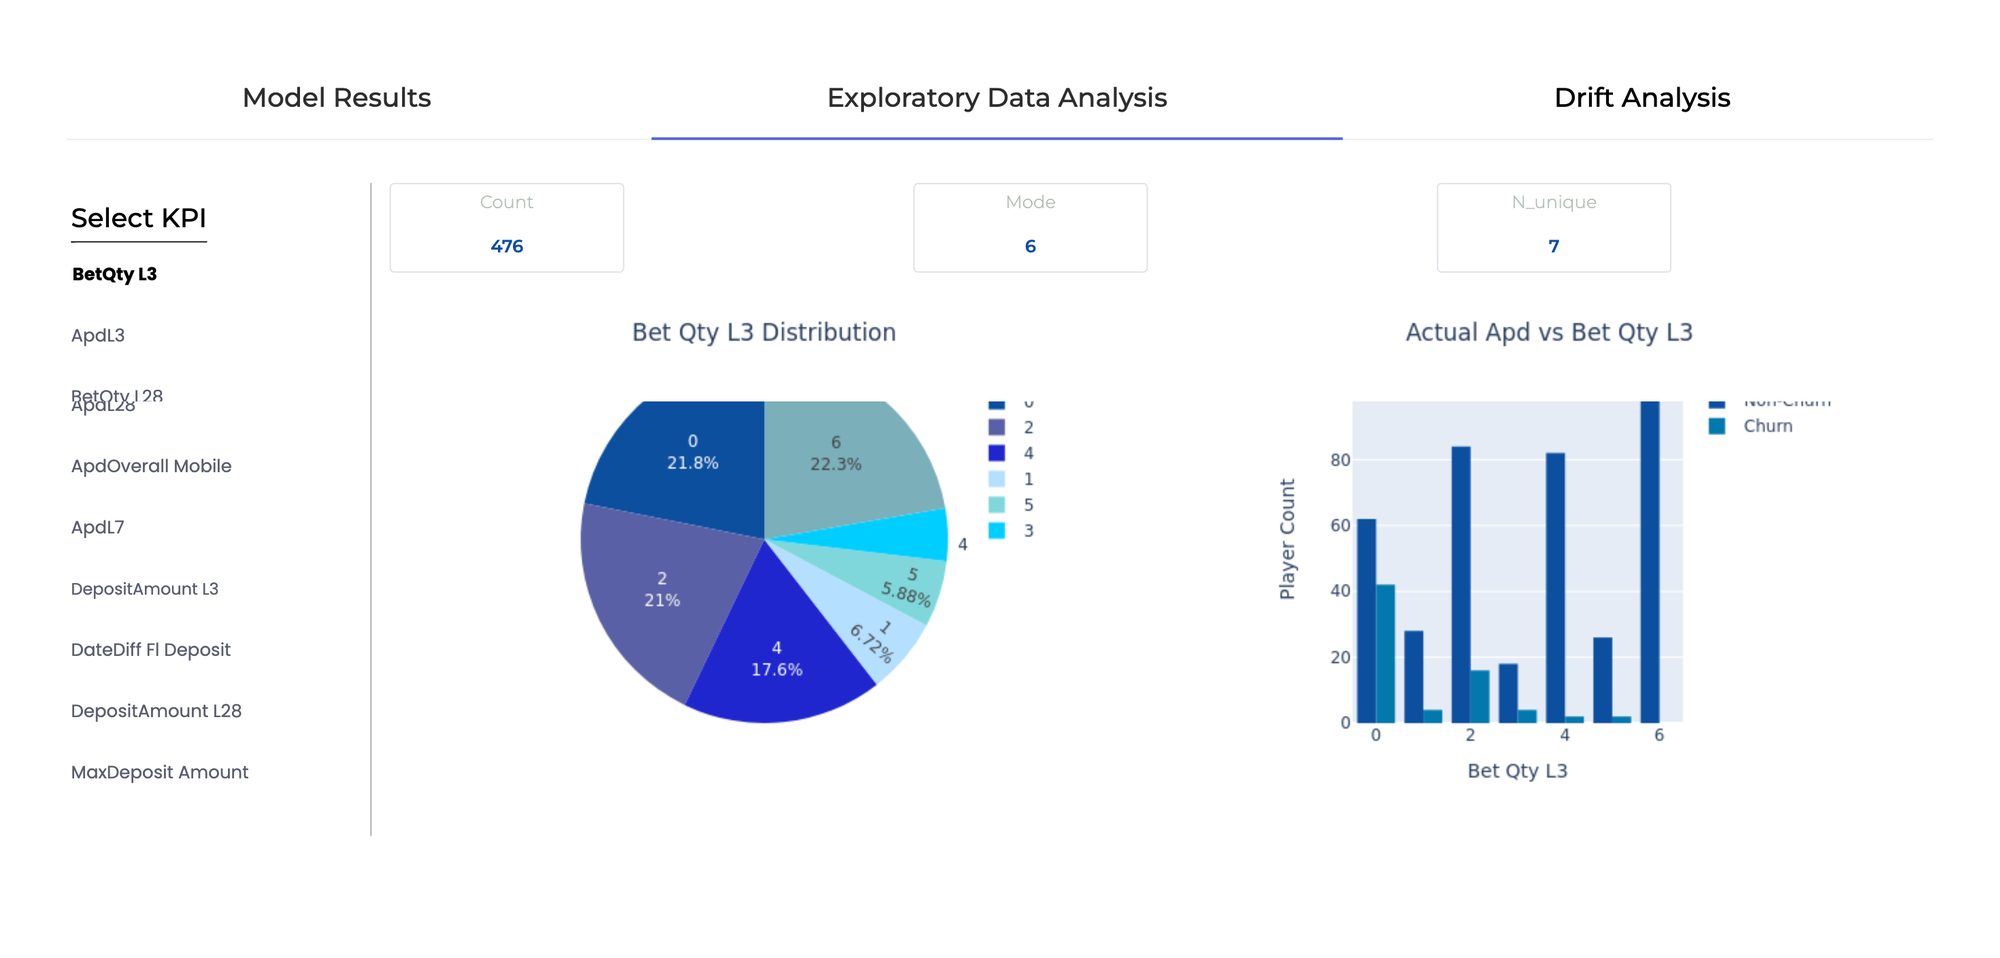
The behavior behind the score. Pick any KPI the model read and see how the outcome splits across it, so the team can check the model against what it already knows.
Shown for the Player Churn model. Sample data.
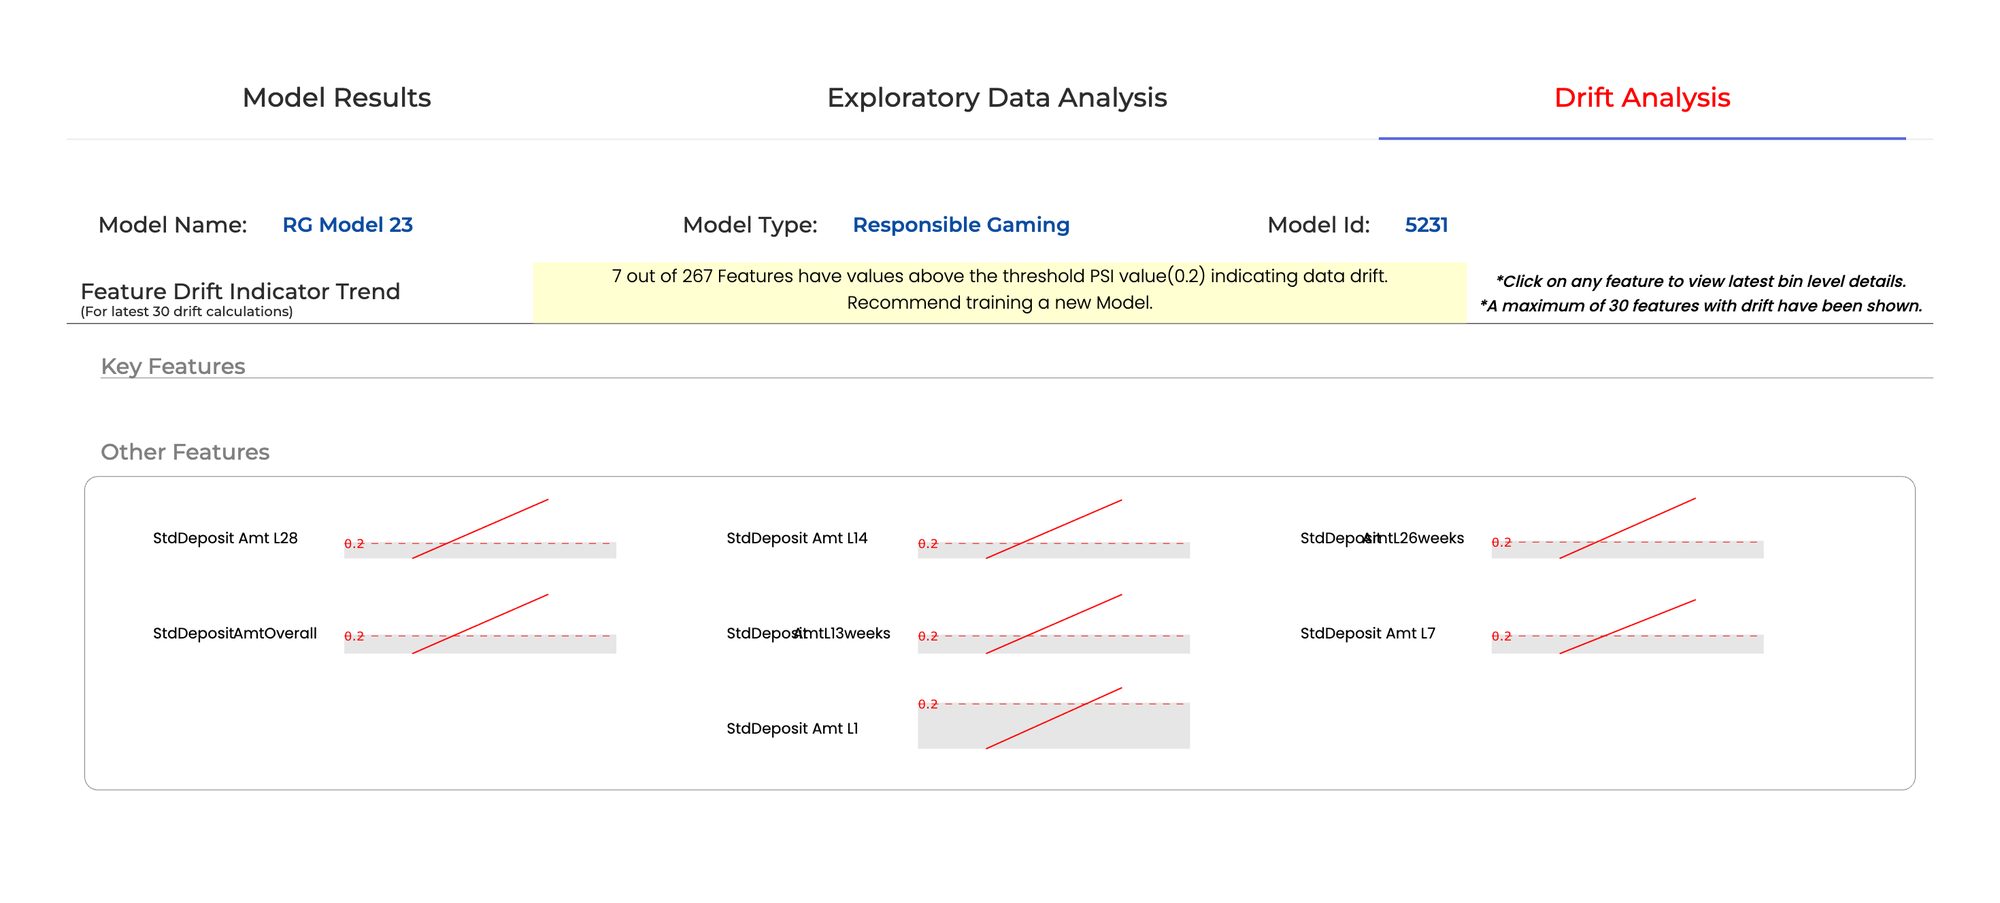
Every signal the model reads is watched for change. When enough of them have drifted from what it learned on, the screen says so and recommends retraining.
Shown for the Responsible Gaming model, 267 signals. Sample data.
Getting started
What you need to get started
The Hold Percentage model at a glance
- What you get
- A number per player (regression)
- Predicts
- The expected hold percentage for each player over the next 30, 75, 90, 180, 270 or 365 days
- Recommended window
- 180 or 360 days
- Output
- Expected hold percentage per player, as GGR divided by bets
- Data it reads
- Betting activity, NGR, GGR, deposits and withdrawals
- History needed
- 90 days to start. 1 to 1.5 years kept for model stability.
What it asks of your team
No data science team
Marketing, Finance, Risk and Compliance teams use it directly, without an analytics background.
Works with your data as it is
Wherever and however your gaming data is stored, the GAMWIT team handles the connection. See how GAMWIT connects
Runs on its own
Once connected, the model runs on its own and delivers fresh predictions on every run.
Recognized by the industry.
 FinalistCompliance Innovator of the YearVixio · 2024
 NominatedCompliance Technology ProviderEGR North America · 2024
 NominatedData and AI PartnerEGR B2B · 2022 · 2023
Run GAMWIT's Hold Percentage on your own players.
The Hold Percentage model is already built. Connecting your data takes 2 to 4 weeks.
The other eight models
- Player ChurnWho is likely to leave in the next seven days?See the model
- Player Lifetime ValueWhat is each player worth over a lifetime?See the model
- Early VIP PredictionWhich of this week's signups are on a VIP path?See the model
- Player FrequencyHow often will each segment come back this month?See the model
- Game RecommendationWhich game should each player be shown next?See the model
- Bonus Abuse PreventionWhich accounts are likely to work the promotion?See the model
- Responsible GamingWho needs a look before the regulator asks?See the model
- Anti-Money LaunderingWhich activity should the compliance team see first?See the model