
Dashboards
GAMWIT Dashboards show the whole business, with a different screen for each level of it. An executive and a floor manager do not need the same numbers.
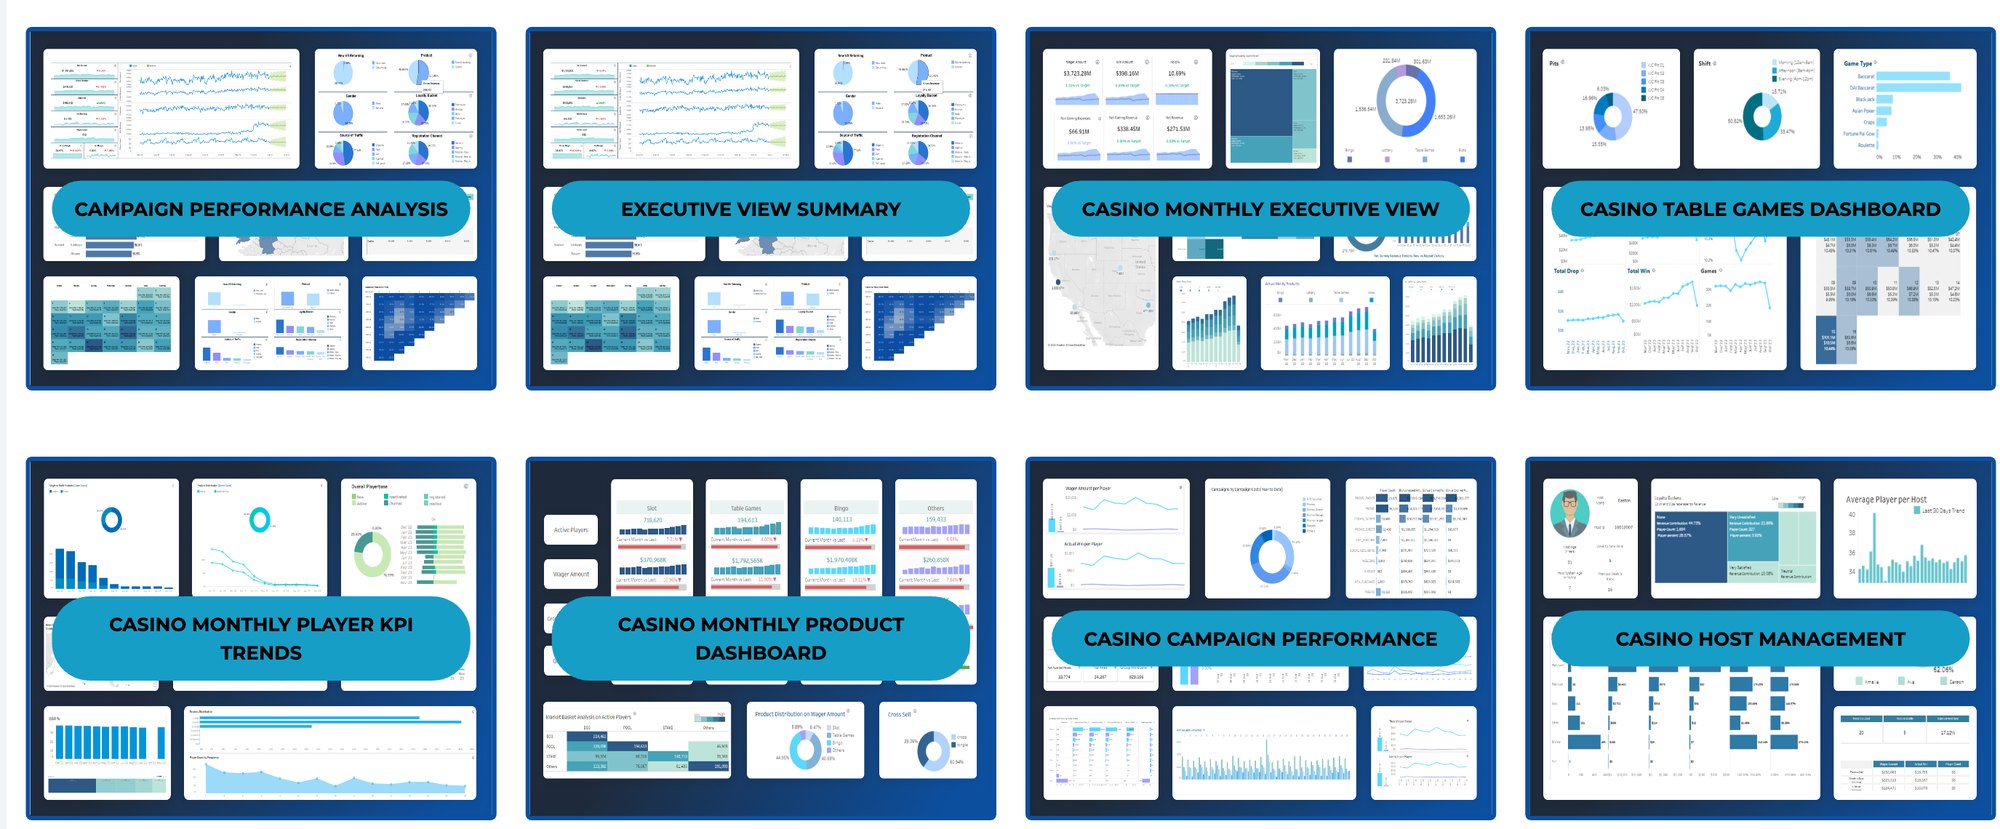
Why dashboards matter
Different people in the business need different numbers.
The data for each of them usually sits in separate systems. GAMWIT Dashboards bring it into one place, with a view built for each level.
See what your team getsExecutives
The whole business at a glance.
Managers
Their own area, with a way to drill down.
Operations teams
What is happening on the floor today.
What each level of your team sees
Real GAMWIT dashboards, one for each level of the business, from a licensed account and the trial. Sample data throughout.
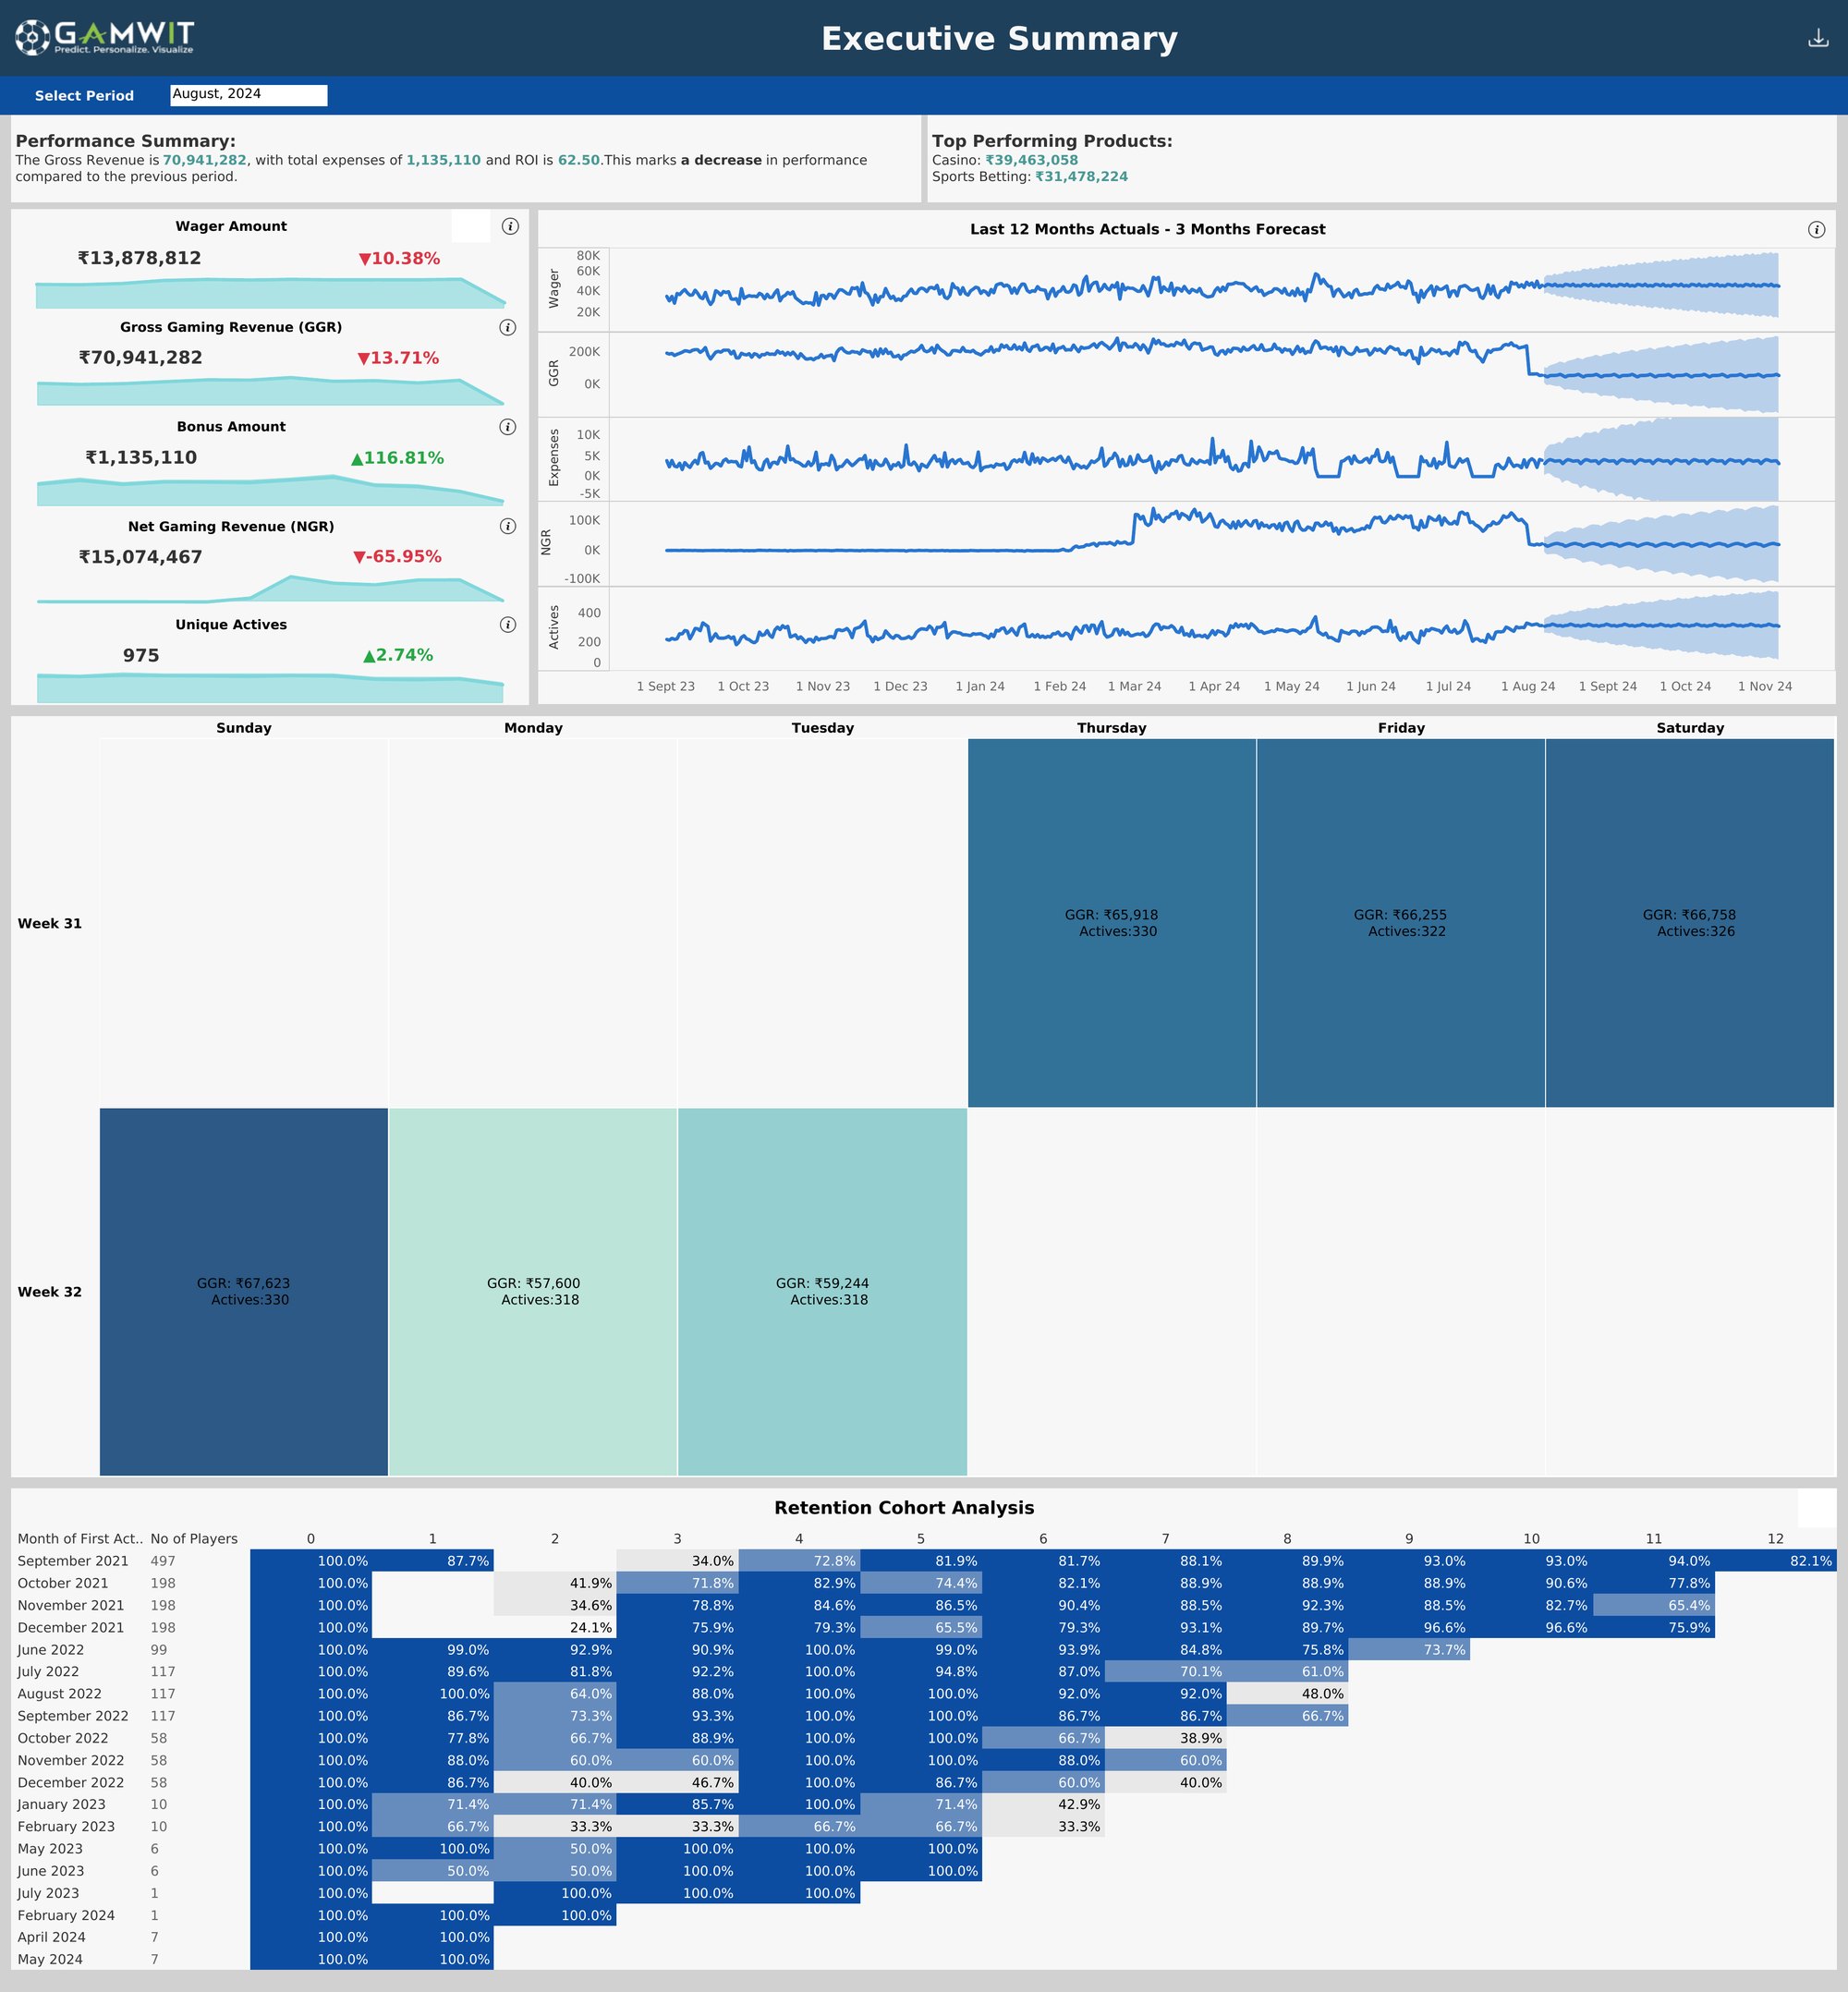
Strategic: Executive Summary
Wager, GGR, bonus, NGR and actives against the previous period, twelve months of actuals with a three-month forecast, the week on a calendar, and the retention cohort table. One screen for the Monday meeting.
Exported from a licensed account. Sample data, August 2024.
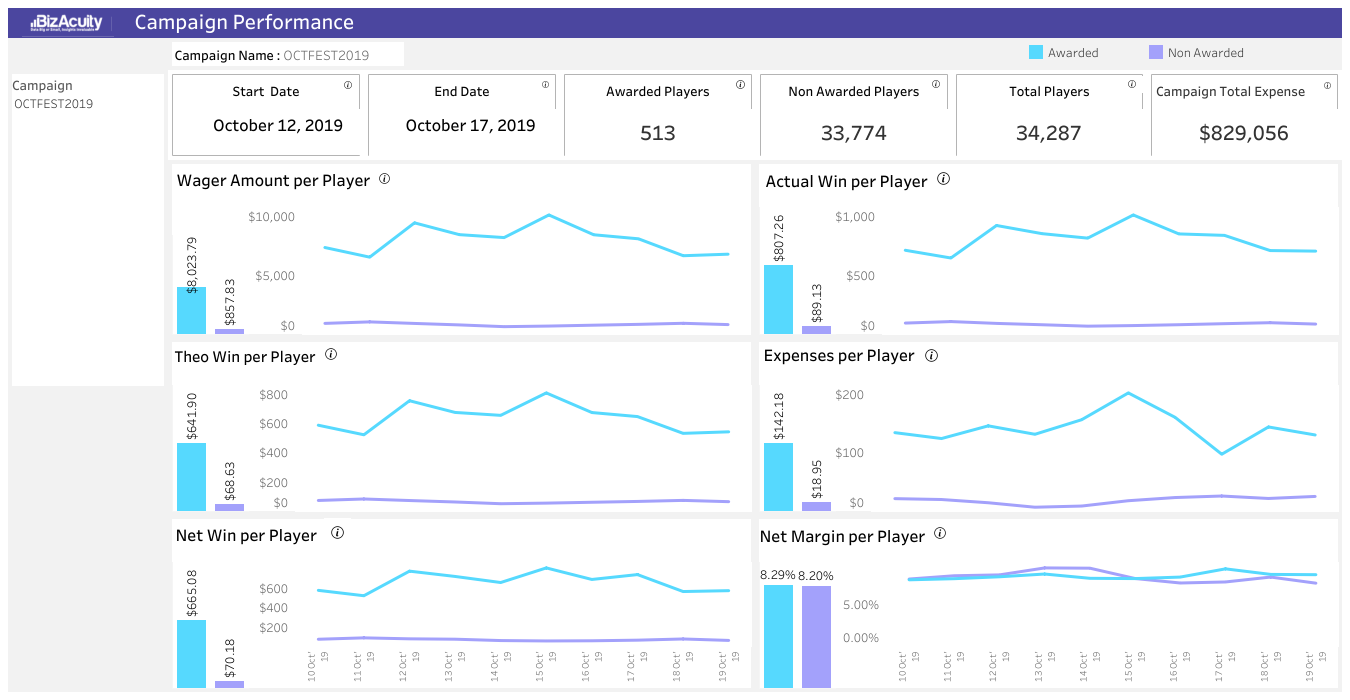
Tactical: Campaign Performance
One campaign, awarded players against everyone else, on wager, win and margin per player. The screen a marketing lead reads the morning after.
Sample data, October 2019.
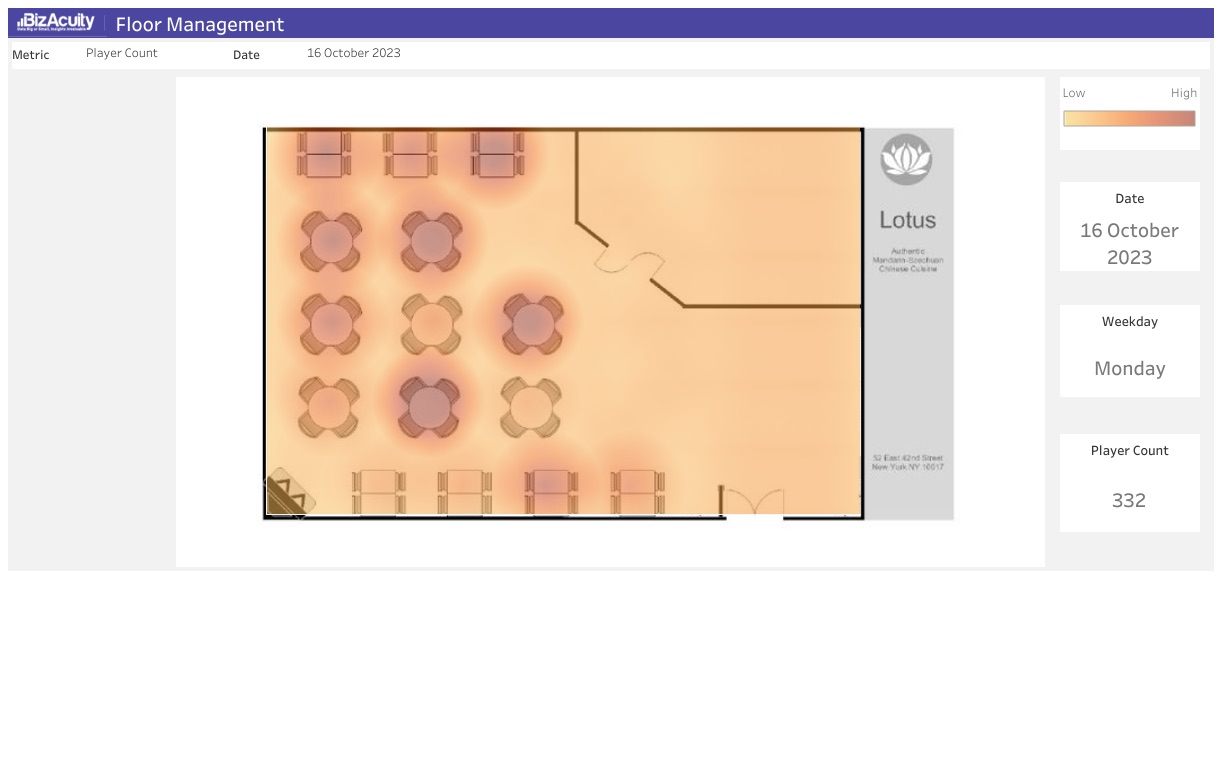
Operational: Floor Activity
Player density over the actual floor plan, by metric and by day. Casino floor and restaurant floor, for the people who move staff and tables.
Live export from the trial account. Sample data, October 2023.
This is sample data. In a walkthrough, we show Dashboards on your own numbers.
Book a walkthroughWhat changes
What changes when GAMWIT builds the dashboard for gaming
A standard BI dashboard build, compared with GAMWIT Dashboards.
Data sources
Without GAMWITScattered across systems, unified by hand into a spreadsheet each week.
With GAMWITIntegrated at the source, so one view holds all of it.
Depth
Without GAMWITLimited granularity, and no way to drill into the number that looks wrong.
With GAMWITDrill down across time, geography, product and player segment, from the summary to the individual driver.
Audience
Without GAMWITOne report for everyone, useful to few.
With GAMWITStrategic, tactical and operational views, each built for its level.
Time horizon
Without GAMWITReporting on what already happened.
With GAMWITReal-time and predictive views alongside the historical ones.
Build and upkeep
Without GAMWITA team of developers and consultants, metrics defined from scratch, and costs that keep rising.
With GAMWITGaming KPIs predefined and auto-calculated. Business users manage the dashboards themselves, and updates apply automatically.
Time to live
Without GAMWITQuarters, through custom build cycles.
With GAMWITWeeks, with GAMWIT's ready-to-use dashboards.
How it works
How GAMWIT Dashboards are organized
Why reporting falls short
Fragmented data
Pulling scattered data from different systems into a unified view is the first job, and it usually consumes the time meant for analysis.
Detail lost in aggregation
Bringing several sources together usually means totals only, and the detail that made the data useful is gone.
No way to drill down
Decisions stall when a number looks wrong and there is no path from the summary to the reason behind it.
You cannot see what players do
Keeping high-value players and improving their experience needs a level of detail most reporting never reaches.
Data that cannot be cut the way the question needs
Forecasting trends and optimizing operations needs data that can be cut any way the question demands. Most reporting only offers the cuts it was built with.
Strategic
A high-level view of goals, current progress and what is coming, with forecasts and projections. Executive Summary and Revenue dashboards sit here.
Tactical
Spot a problem the day it starts, then plan staff and budget around it. Host Management, Campaign Performance and Player & Product Summary.
Operational
Performance metrics for a specific area of the business: Slots revenue and activity, Table Games revenue and activity, Floor Management, Player Behavior.
Auto-calculated KPIs
Gaming-specific KPIs are predefined and calculated automatically, so the number on the screen does not depend on who built the report.
See it with your team
See Dashboards set up for the questions your team asks.
Book a walkthrough with the GAMWIT team, or start a free trial and explore the platform first.
Getting started
What you need to get started
What it asks of your team
No data science team
Marketing, Finance, Risk and Compliance teams use it directly, without an analytics background.
Works with your data as it is
Wherever and however your gaming data is stored, the GAMWIT team handles the connection. See how GAMWIT connects
Runs on its own
Once connected, it keeps the view current without anyone running a report.
Recognized by the industry.
 FinalistCompliance Innovator of the YearVixio · 2024
 NominatedCompliance Technology ProviderEGR North America · 2024
 NominatedData and AI PartnerEGR B2B · 2022 · 2023
Run GAMWIT's Dashboards on your own data.
The Dashboards tool is already built. Connecting your data takes 2 to 4 weeks.
The nine models
- Player ChurnWho is likely to leave in the next seven days?See the model
- Player Lifetime ValueWhat is each player worth over a lifetime?See the model
- Early VIP PredictionWhich of this week's signups are on a VIP path?See the model
- Player FrequencyHow often will each segment come back this month?See the model
- Game RecommendationWhich game should each player be shown next?See the model
- Hold PercentageWhat share of each player's wagers do we keep?See the model
- Bonus Abuse PreventionWhich accounts are likely to work the promotion?See the model
- Responsible GamingWho needs a look before the regulator asks?See the model
- Anti-Money LaunderingWhich activity should the compliance team see first?See the model